


1
2
3
4
5
6
7
8
9
10
11
12
13
14
15
16
17
18
19


Top view on the cytoplasmic side of the BetP trimer
The C-terminal domain of protomer A is overlaid on the domains of protomer B and protomer C to demonstrate a possible orientation and interaction with the perimeter of the corresponding adjacent protomer. Positions of charged residues within a helical ordered C-terminal domain, which affect reg- ulatory properties in E. coli membranes are colored in orange and those in C. glutamicum membranes are colored in yellow. Unfolding of the C-terminal domain might occur at the last 20 amino acids, which are colored in red. The N-terminal domain and TM1 is colored in blue
C1ql3 KO Decreases Asym Synapse Density
(A) Representative images of asymmetric synapses in adult wild-type and KO PLC, focusing on the cortical layer 2/1 boundary.
(B) Representative images of perforated asymmetric synapses. Arrowheads point to the gap in the perforated postsynaptic density.
(C) Summary graph of the density of asymmetric synapses.
(D) Summary graphs of the density of perforated synapses, and fraction of total synapses that were perforated.
(E–M) Summary graphs of PSD length (E), PSD width (F), width of the synaptic cleft (G), presynaptic terminal area (H), presynaptic terminal perimeter (I), number of presynaptic vesicles per terminal (J), number of docked presynaptic vesicles per terminal (K), presynaptic vesicle density (L), and presynaptic vesicle diameter (M).
(N) Cartoon of two possible mechanisms for C1ql3’s influence on synapses.
Data are means ± SEM; n = 3 mice. Statistical analyses were performed using Student’s t test.
(A) Cell envelopes were fractionated on defined isopycnic sucrose-density gradients. Denaturing-gel electrophoresis and western blotting were used to separate and detect the proteins.(B) Detergent-solubilized affinity-purified PbgA was assessed by size-exclu- sion chromatography (SEC). Dashed lines indicate the elution volumes for the size standards whose masses are indicated.
(C) Multiangle-light scattering (MALS) determined the absolute molecular mass for the PbgA particles to be $286 kDa, with a modest mass contribution from detergent molecules. The LS signal (normalized Rayleigh ratio) is shown in red, the differential refraction index is in blue, and the absolute mass of the peak between 9.0 and 9.5 ml is shown in the black inset.
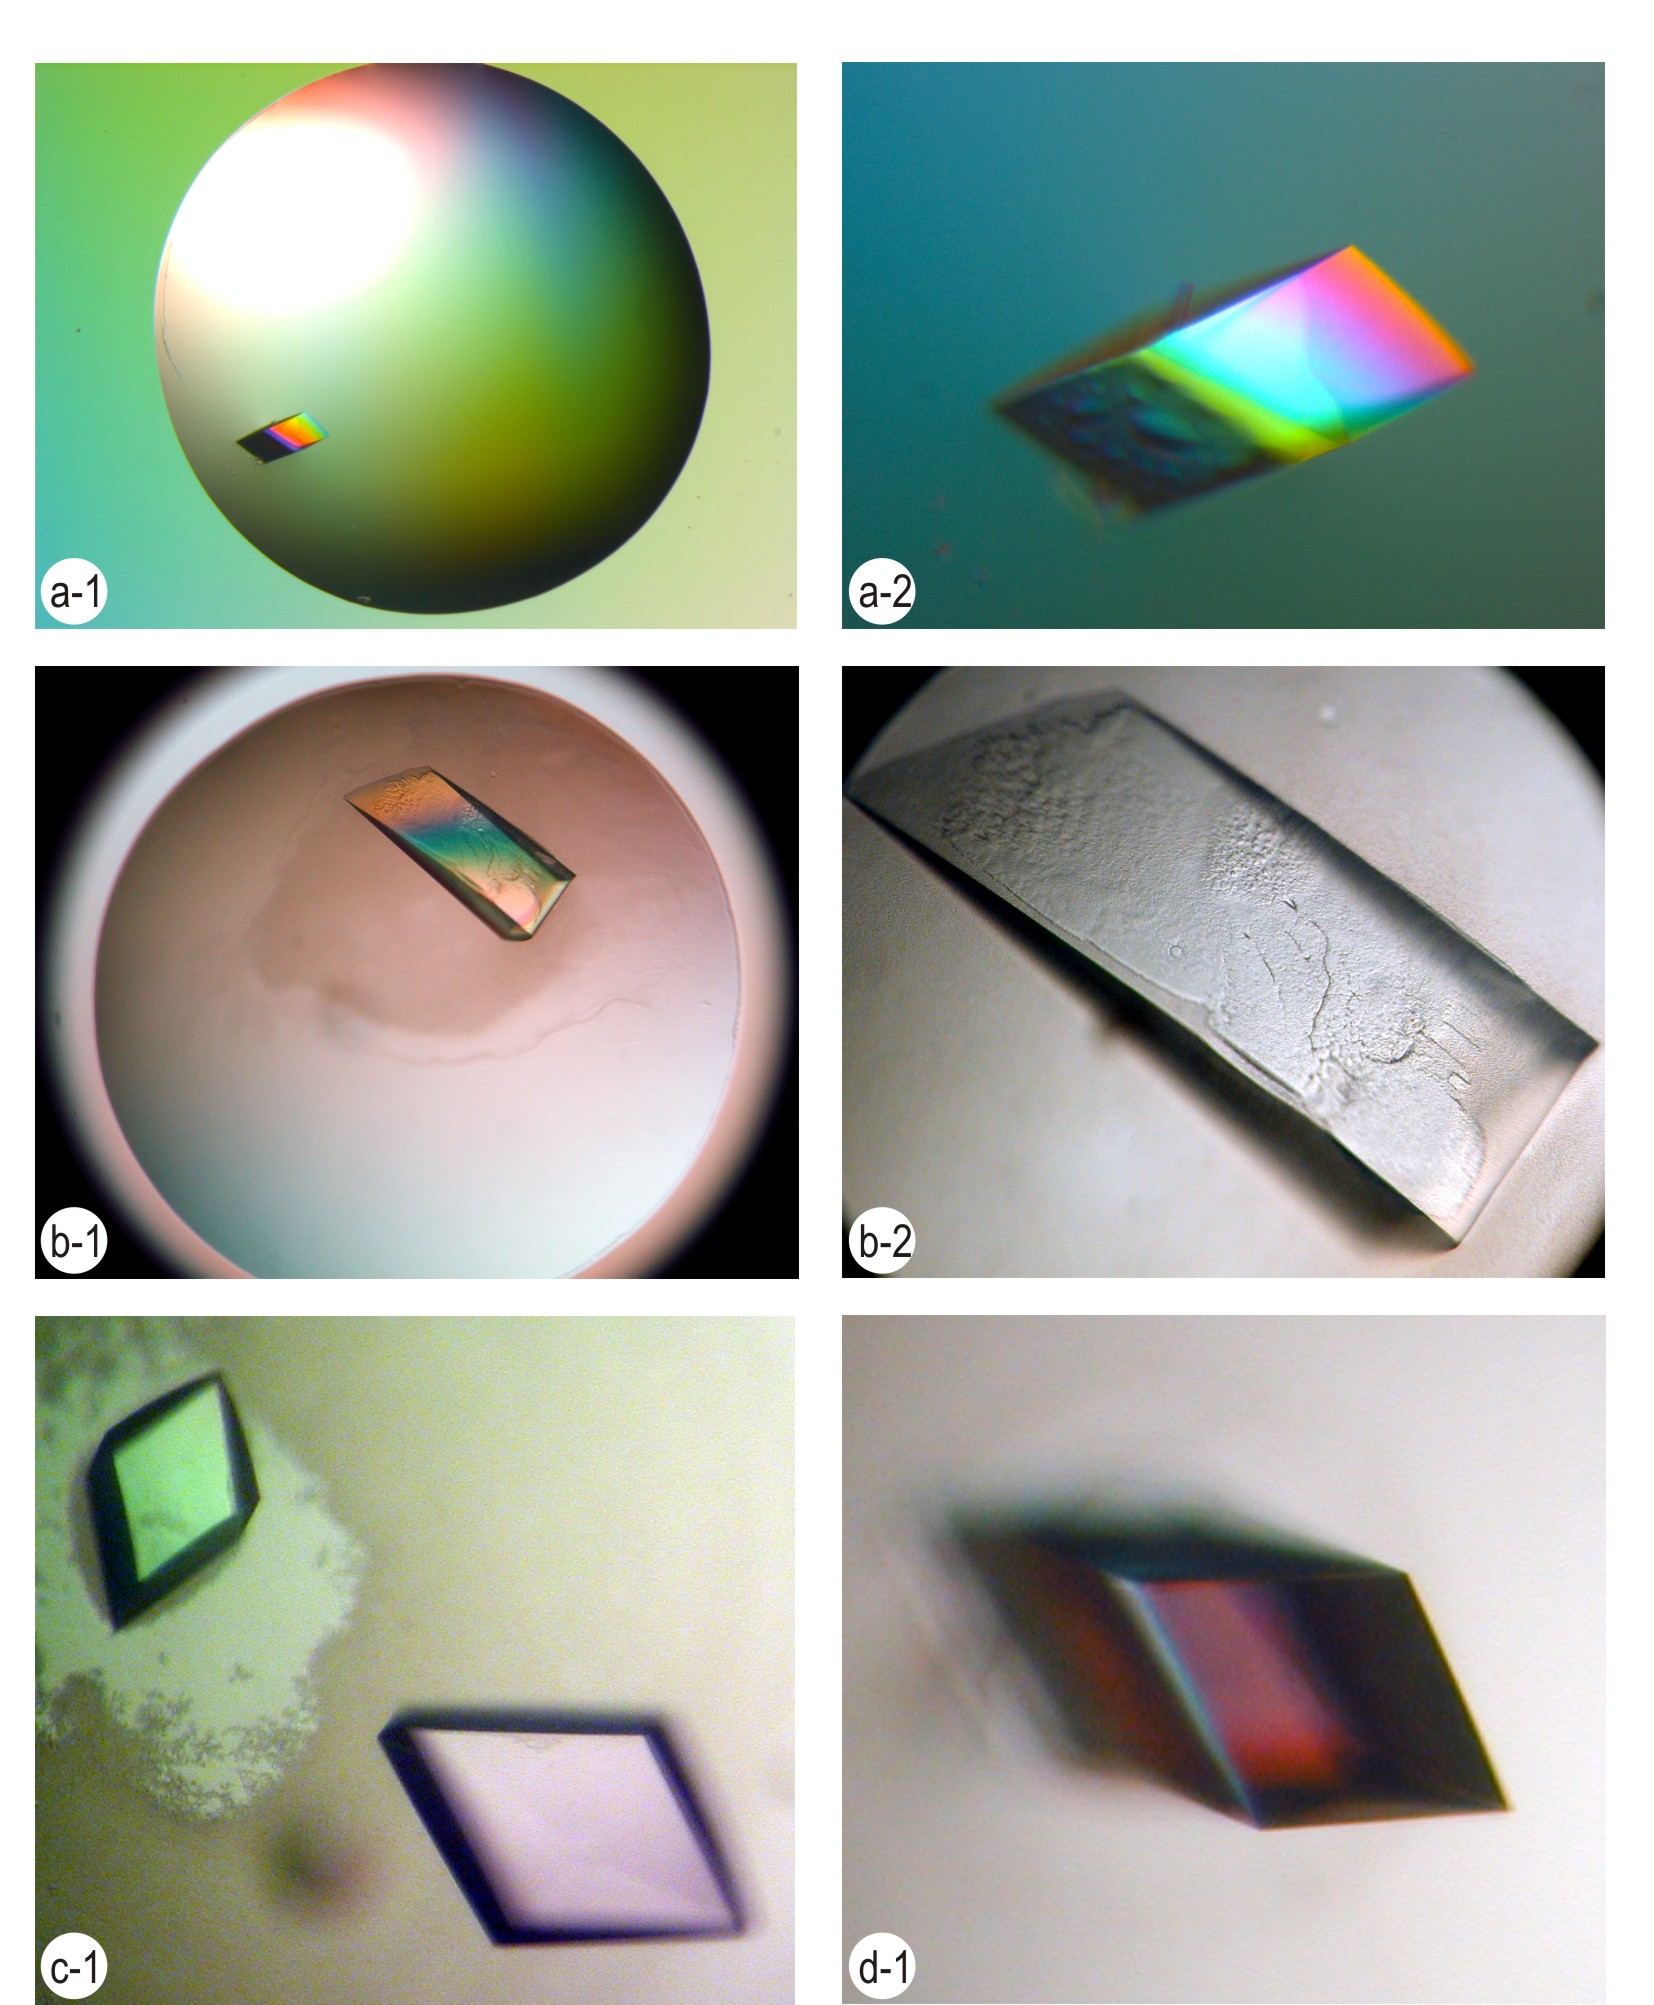
Membrane protein crystals
The betaine-binding site in BetP
a SigmaA-weighted (mFobs- DFcalc)(2mFobs- DFcalc) map (blue), contoured at 1sigma, showing density map for glycine-betaine in red, and the densities for TM4 (light brown) and TM8 (light blue) in blue. Side chains defining the tryptophan box of the betaine-binding motif are Trp189, Trp194, Trp374 and Tyr197. b Approximate same view on the betaine binding site. Residues of the Trp-box are in brown violet and glycine-betaine in black. The inner surface of the binding pocket is shown in transparent blue. Helices of protomer C are light grey.
Four transporter with inverted repeat motif.
Side view on all four structures with the periplasmic side pointing to the top and the cytoplasmic upwards. From each transporter, solely helices building the inverted repeat are shown. The first two helices of the 4-helix bundle in repeat1 are coloured red and orange and the scaffold region of repeat1 in light orange. The first two helices of the 4-helix bundle in repeat2 are coloured dark-blue and purple and the scaffold region of repeat2 in light blue. a LeuTAa outward facing conformation b Mhp1 outward facing conformation c BetP intermediate conformation d vSGLT inward-facing conformation.
Regulatory interactions mediated by the C-terminal domains in BetP
Ionic interactions of the C-terminal domains and the involved helices of monomer A (grey), monomer B (blue) and monomer C (brown-purple) with loop 2 (yellow) and loop 8 (red) on the cytoplasmic side. The two positively charged clusters in each domain are shown in light blue. Residues forming salt bridges are shown in stick representation and labelled separately.
Model of betaine transport in BetP
(A) Proposed Na þ -coupled betaine and choline binding in BetP and BetP-G153D. Shown are the first helices of each repeat (bundle): 1 (red) and 6 (dark blue); and the third helix of each repeat (hash domain): 3 (orange) and 8 (light blue) according to LeuT nomenclature for better comparison. The dashed circle in the outward-facing open state (Ce-state) assign the position of Na2 sodium-binding site. A putative extracellular gate is shown as red bar in the Ce-state, in a transient outward-facing state with the extracellular gate open (Ce*-state) and in the substrate occluded outward-facing state (SocCe-state). Pink spheres represent sodium ions occupying the Na2 site, and green circles represent the trimethylammonium group of betaine and choline. The light pink spheres represent sodium that might occupy a putative Na1 site to coordinate the carboxyl group of the substrate (SocCe-state in BetP). (B) Proposed Hþ-coupled choline transport in BetP-G153D. Binding of cationic choline to the Na2 sodium-binding site might open the extracellular gate (SCe-state). SocCi- and SCi-states assign for a substrate occluded inward-facing state and for a substrate bound inward open state, respectively. SCi-state corresponds to the conformation of the crystal structure and is labelled by a red box. Ci-state stands for the inward-facing open state. A putative intracellular gate is shown as blue bar located at the cytoplasmic half of the first helix of the second repeat.
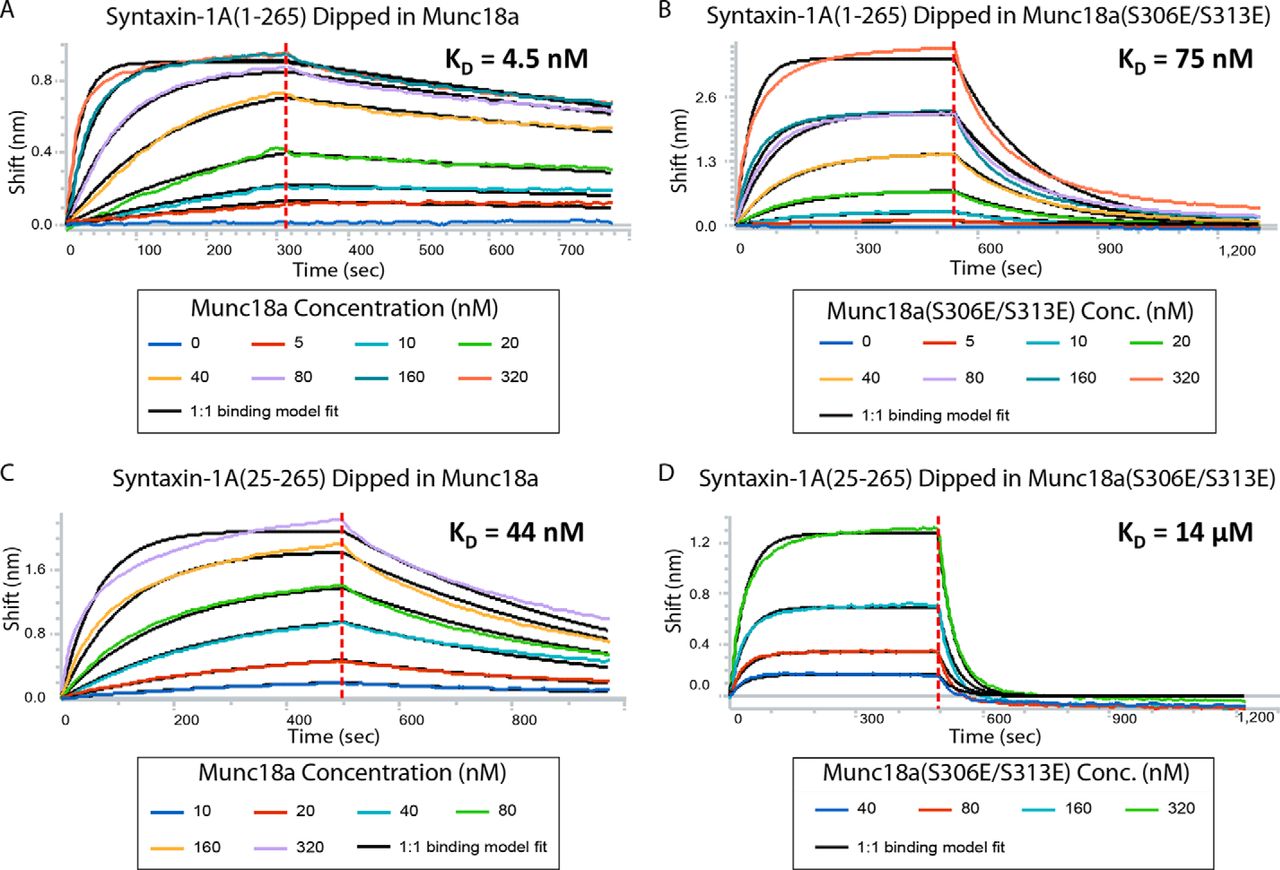
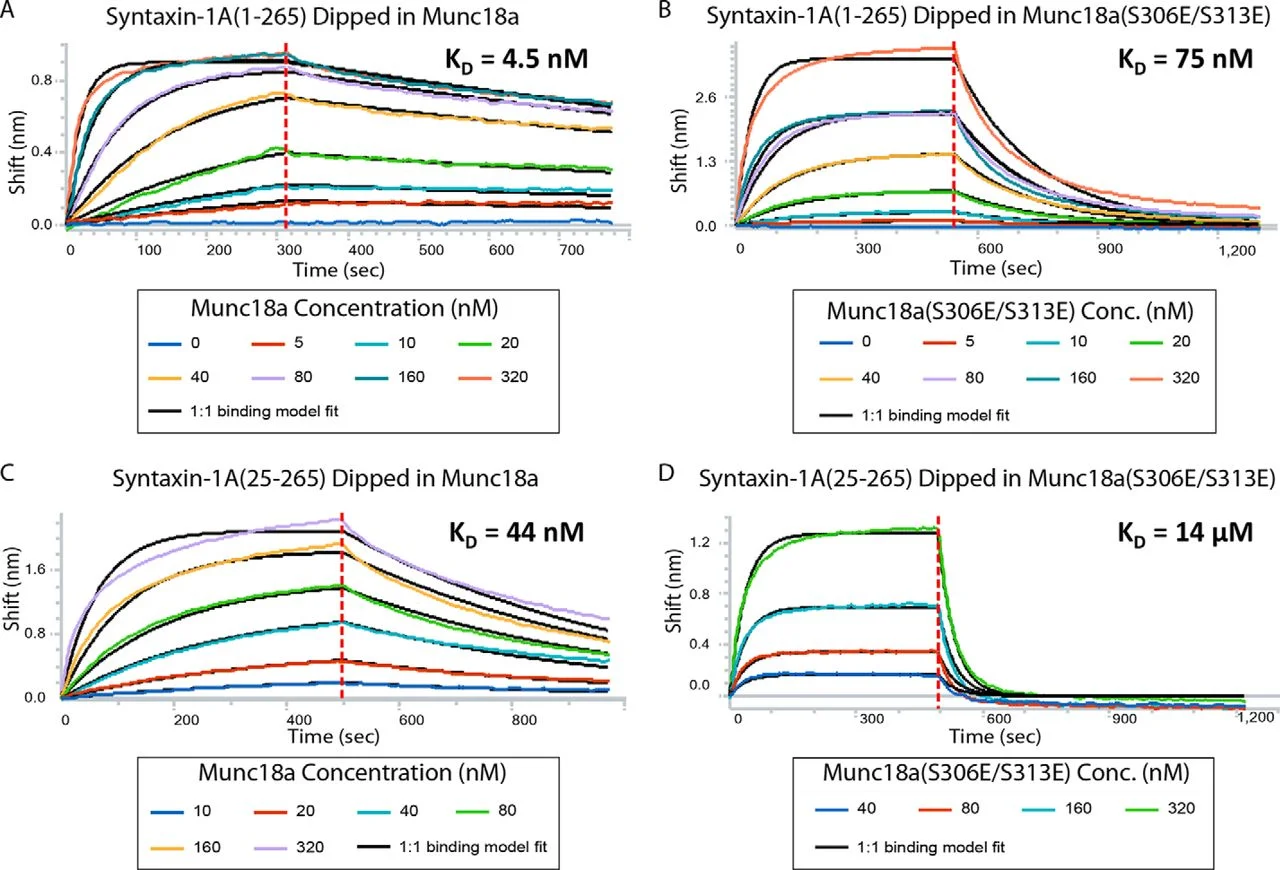
BLI of Munc18a binding to syntaxin-1A
Bio-layer interferometry experiments of Munc18a and Munc18a(S306E/S313E) binding to syntaxin-1A(1–265) or syntaxin-1A(25–265) constructs that had been surface-immobilized with a C-terminal biotin tag.
Sensograms are fit to a 1:1 binding model (black lines). Specified concentra- tions of Munc18a were used. The dissociation constant of wild type Munc18a to Stx1a(1–265) is 4.5 nM (A), that of Munc18a(S306E/S313E) to Stx1a(1–265) is 75 nM (B), that of Munc18a to Stx1a(25–265) is 44 nM (C), and that of Munc18a(S306E/S313E) to Stx1a(25–265) is 1,400 nM (D).
The initial electron density map of BetP
The initial observed electron density map shown in blue at 1.3sigma after solvent flattening with 64% solvent content. The anomalous difference map for the selenium sites is shown in red at 3.5sigma.
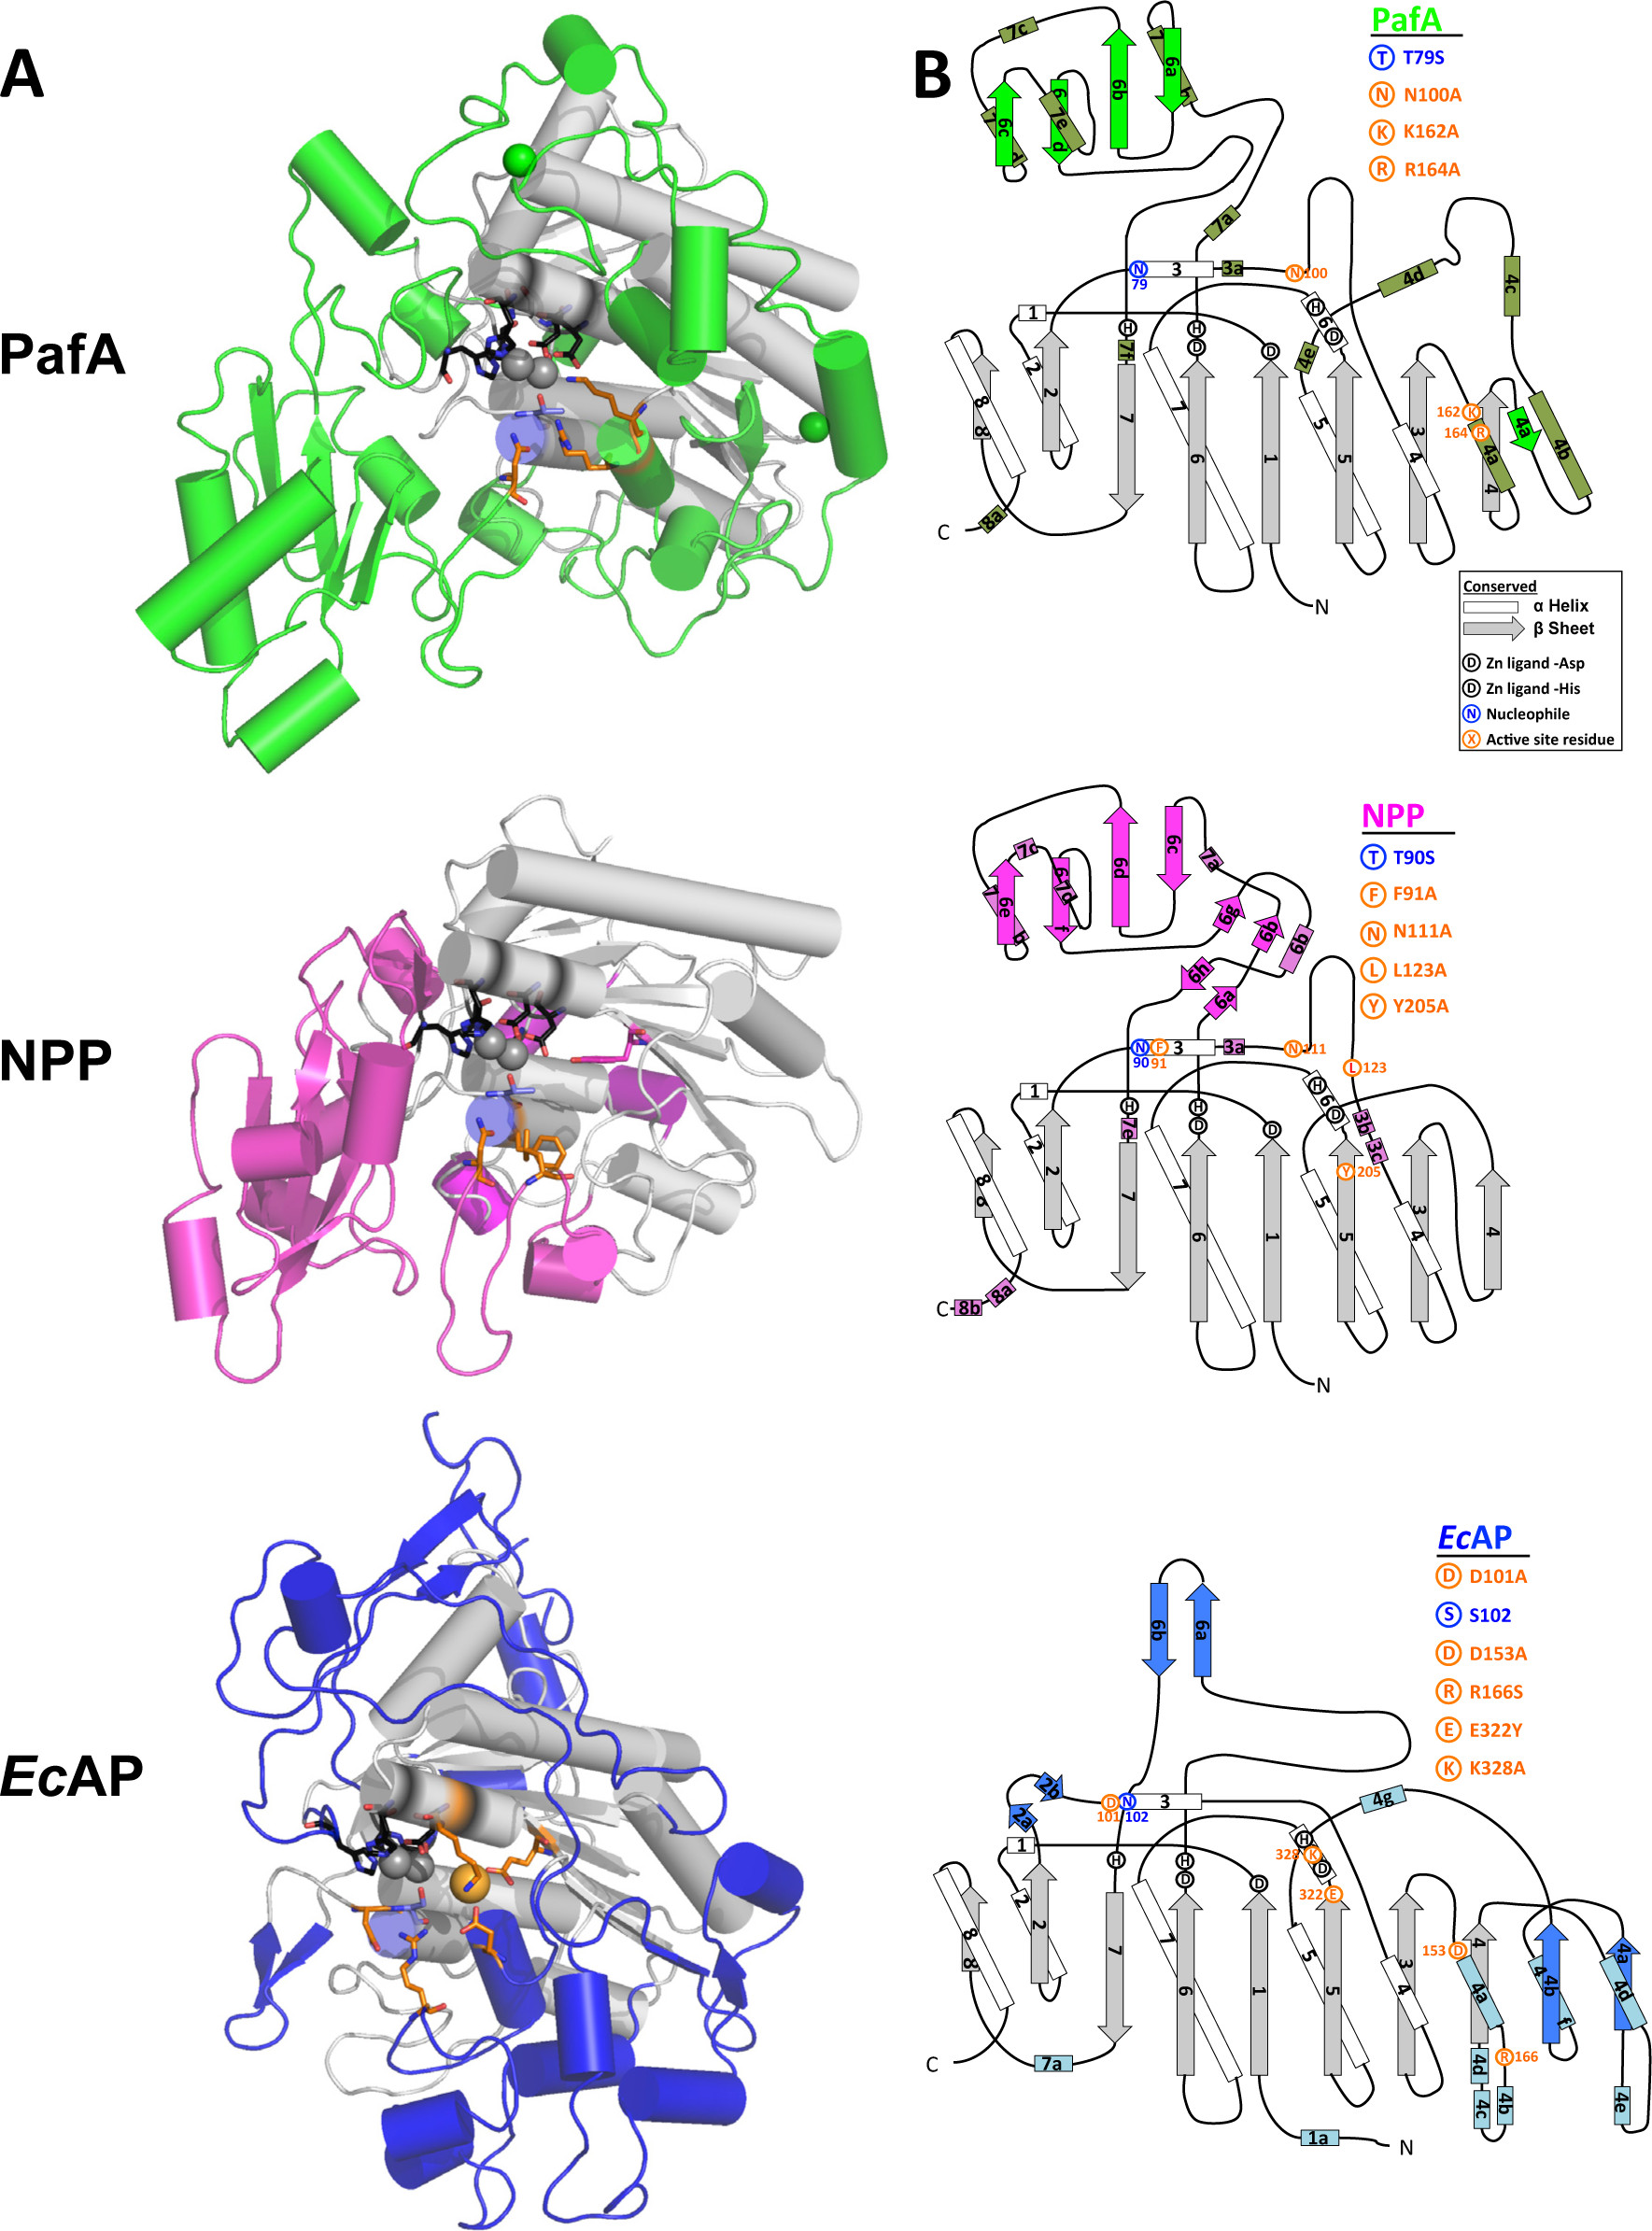
Global structure and active site of PafA, NPP, and EcAP.
(A) Comparison of the global structure of PafA, NPP, and EcAP. The structurally conserved core and bimetallo Zn2+ (spheres) are shown in gray, conserved zinc ligands are shown in black, and auxiliary domains that are not conserved between all three enzymes are shown in color; PafA in green, NPP in magenta, and EcAP in blue. The active-site nucleophile (threonine or serine) is shown in blue, and other active-site residues and EcAP Mg2+ (sphere) are shown in orange. (B) Topographic diagrams for PafA, NPP, and EcAP, with arrows representing β-sheets and rods representing α-helices. Gray represents conserved sheets and white conserved helices, and the auxiliary regions that are not conserved between all three enzymes are colored: PafA, helices in olive, sheets in green; NPP, helices in purple, sheets in magenta; and EcAP, helices in light blue, sheets in blue. Structures are from 3tg0 (EcAP,96) and 2gso (NPP,32) with ligands removed for clarity.
Alkaline phosphatase (AP) structure and active site.
(A) The three-dimensional structure of AP with bound Pi (PDB 3TG0). Active site residues are depicted as follows: D101, brown; R166, black; D153, red; K328, green; E322 and Mg2+ ion, blue. (B) A close-up of AP active site from two angles. Dashes represent putative hydrogen bonds. Residues colored as in part (A). (C) Schematic of AP active site interactions represented with the phosphoryl transfer transition state. Residues colored as in part (A). (D) Reaction scheme for phosphomonoester hydrolysis by AP, where ROP represents a phosphate monoester dianion substrate, and E-P represents the covalent seryl-phosphate intermediate (Coleman, 1992).
DOI: 10.7554/eLife.06181.003
Crystal Structures of Globular C1q Domains of C1QL1, C1QL2 and C1QL3
(A) Crystal structures of C1QL1, C1QL2, and C1QL3 globular C1q domains are shown in two different views (cartoon representation). One of the protomers of each C1QL structure is colored using a rainbow coloring scheme from the N terminus (blue) to the C terminus (red), while the other two protomers are colored in gray. Ca2+ ions are colored magenta and displayed as spheres.
(B) Electrostatic potential surfaces of the C1QL1, C1QL2, and C1QL3, apo and Ca2+-bound adiponectin (also referred to as Acrp30 or Adipoq, PDB ID 1c3h), immunological C1qABC (Complement System Protein C1q Chain A,B,C) (PDB ID 1pk6) (Gaboriaud et al., 2003b), and C1QTNF5 (PDB ID 4f3j) (Tu and Palczewski, 2012). All structures are displayed in the same top view as in (A). The electrostatic potential surfaces were calculated as described in the Experimental Procedures and colored according to the range –7 kT/e (red) to 7 kT/e (blue).
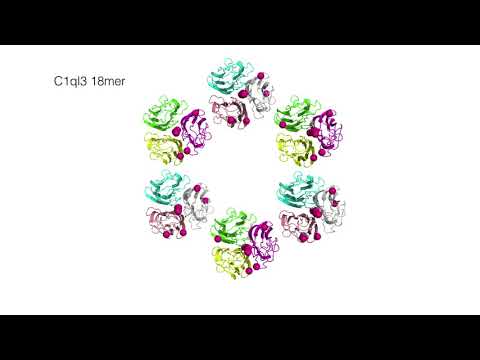
Oligomers of the C1QL3 Globular C1q Domain
(A) SEC-MALS experiment of C1QL3 injected at a concentration of 7.5 mg/ml. The line in purple shows the measured light scattering signal (normalized Rayleigh ratio, left y axis) as a function of elution volume (ml) (x axis). The light gray line shows the molecular mass calculated from the differential refractive index and light scattering measurements along the elution volume between 8.7 ml and 11.8 ml. The green line shows a multi-Gaussian fit analysis of the light scattering signal in the elution range between 7.5 ml and 10 ml. The black segments along the gray line indicate the fractions selected by the multi-Gaussian fit analysis, and the corresponding molecular masses (in kDa) are compatible to 3-mer, 6-mer, and higher-order oligomers.
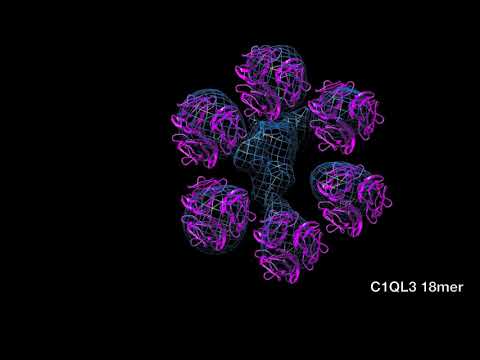
(B) Putative C1QL3 18-mer ring produced by crystal packing in the P1 crystal form of C1QL3 at pH 6.5 (Table 1). Top view and side views showing a ring of six trimers formed by crystal packing (purple surface representation) along with the remaining nearby molecules produced by both noncrystallographic and crys- tallographic translational symmetry (gray cartoon representation). The specified diameter is the largest extent of the 18-mer oligomer.
(C) Docking of the C1QL3 18-mer ring (purple) into the density map of the single particle negative stain EM reconstruction of adiponectin (blue), shown in top, tilted, and side views.
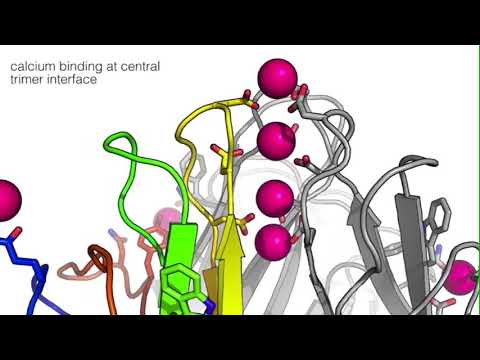
C1QL protein Ca2+-binding sites at β-strands D and G
C1QL1, C1QL2, and C1QL3 are shown in cartoon representation and colored as a rainbow gradient from the N-terminus (blue) toward the C-terminus (red). The Ca2+binding sites near β-strand D (green) involving aspartate D190 and near β-strand G (orange) involving aspartate D232 are shown for both C1QL1 and C1QL3. Tyrosine Y245 (grey) in loop L8 of the neighboring protomer coordinates the Ca2+-ion (magenta sphere) in C1QL1 and C1QL3. In C1QL2, arginine R168 (grey) from a crystallographic symmetry related molecule binds to the pocket that is devoid of Ca2+.
C1ql3-Expressing Neurons in the BLA Project to the mPFC
(A) Strategy for stereotactic injections of tdTomato-expressing rabies virus as a retrograde tracer into the mPFC of 9-week-old C1ql3flox/flox mVenus- reporter mice.
(B) Representative section to illustrate tdTomato expression after rabies virus injection (PLC, prelimbic cortex; ILC, infralimbic cortex).
(C) Representative section to illustrate tdTomato/C1ql3 co-expression in the BLA and piriform cortex.
(D) Magnification of boxed BLA region in (C).
(E) Magnification of boxed region in (D).
(F) Magnification of boxed piriform region in (C).